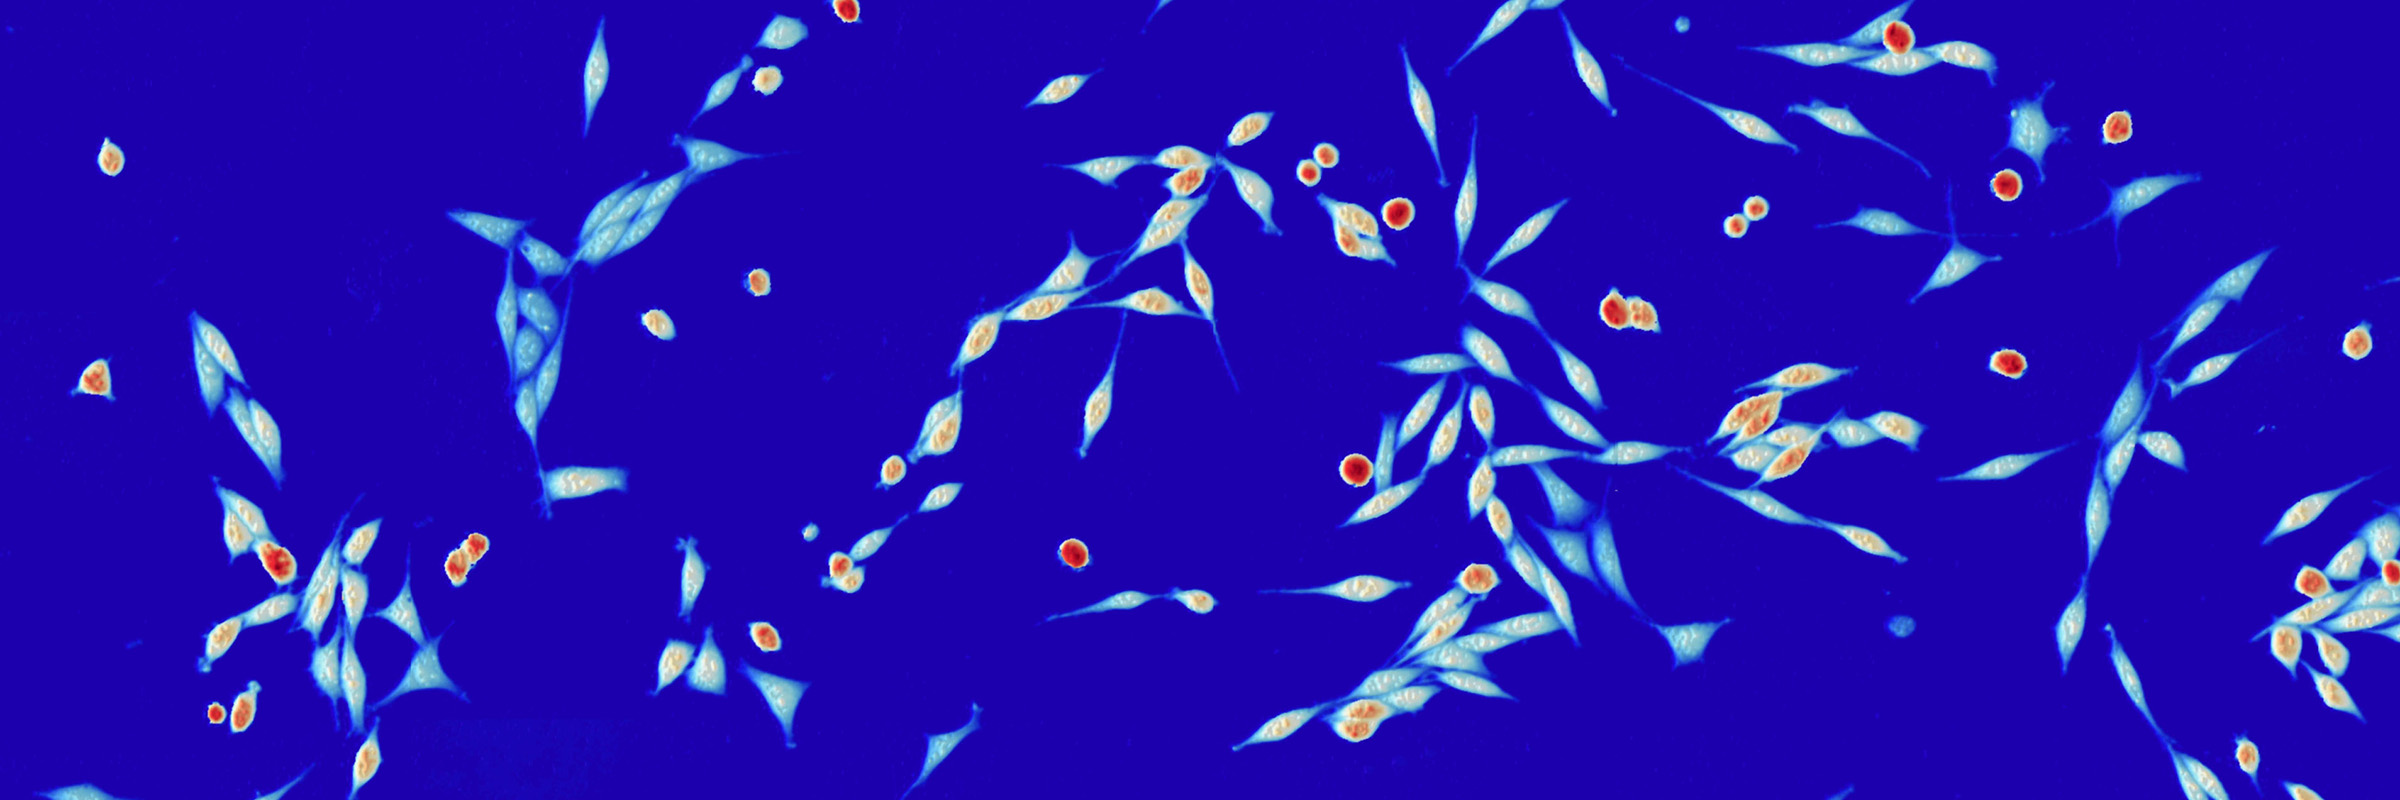
Visualization and Integration of Cancer Cell Response Data by Quantitative Phase Imaging

Quantitative phase imaging (QPI) is a microscopy method that can be used to monitor cell behavior or response to targeted therapy. Both the Judson-Torres and Zangle labs at the University of Utah work on applications of QPI to study cancer. The Zangle lab uses a model-based approach. For example, predictions of how mass increases over time due to growth or how stiffness is related to changes in cell mass serve as models that can be fit to experimental data to extract parameters describing cell behavior. The Judson-Torres lab uses a more data-based approach, by for example, identifying features that predict cancer cell behavior or disease progression with machine learning. Both approaches yield distinct outputs that are linked through the same underlying data type. Co-I Lex’ lab develops interactive data visualization methods for biomedical applications.
This project will develop and transfer new knowledge (U Utah Strategic Goal 1) by combining validation experiments with data visualization. Central to this effort is generating comparisons of distinct QPI data sets. Therefore, the visualization approaches of the Lex lab will be essential. Key questions to be addressed by the conclusion of this project are: 1) Do Zangle lab and Judson-Torres lab methods produce data with equivalent clinical utility? 2) How can disparate QPI data types be presented in a way that maximizes usefulness, either in a research or clinical setting?
Current Status
2021-09-14
Abstract:
Quantitative phase imaging (QPI) is a microscopy method that can be used to monitor cell behavior or response to targeted therapy. Both the Judson-Torres and Zangle labs at the University of Utah work on applications of QPI to study cancer. The Zangle lab uses a model-based approach. For example, predictions of how mass increases over time due to growth or how stiffness is related to changes in cell mass serve as models that can be fit to experimental data to extract parameters describing cell behavior. The Judson-Torres lab uses a more data-based approach, by for example, identifying features that predict cancer cell behavior or disease progression with machine learning. Both approaches yield distinct outputs that are linked through the same underlying data type. Co-I Lex’ lab develops interactive data visualization methods for biomedical applications. This project developed and transfer new knowledge (U Utah Strategic Goal 1) by combining validation experiments with data visualization. Central to this effort was generating comparisons of distinct QPI data sets. Therefore, the visualization approaches of the Lex lab will be essential. Key questions to be addressed by the conclusion of this project are: 1) Do Zangle lab and Judson-Torres lab methods produce data with equivalent clinical utility? 2) How can disparate QPI data types be presented in a way that maximizes usefulness, either in a research or clinical setting?
Collaborators
Thomas Zangle
College of Engineering
Chemical Engineering
Project Owner
Robert Judson-Torres
School of Medicine
Dermatology
Alexander Lex
College of Engineering
School of Computing
Project Info
Funded Project Amount$30K
Keywords
Cancer diagnosis, machine learning, microscopy, data visualization
Project Status
Funded 2020
Poster
View poster (pdf)
